Overview
The ETF Comparison page allows you to see detail on any Exchange-Traded Fund (ETFs) listed in the U.S. and compare it to other similar ETFs, in terms of performance, Power Gauge Rating, Chaikin Power Bar, and other key statistics.

Classification
Chaikin classifies all US-listed ETFs according a 3-level hierarchy: ETF Category / ETF Group / ETF Subgroup.
- ETF Category is based on the primary type of asset held by the ETF.
- ETF Group is the primary comparison group of the ETF.
- ETF Subgroup is a more specific set of similar ETFs within the ETF Group.
All ETFs are assigned to one ETF Category and ETF Group. (Most, but not all, are assigned to a subgroup.)
Although many ETFs have multiple characteristics, rules are applied to assign all ETFs to only one Category and Group.
- Inverse ETFs hold a particular asset type as a short position, allowing investors to bet on downside activity.
- Leveraged ETFs are structured to return a multiple of the underlying asset performance. For instance, the SPXL – Daily Direxion S&P 500 Bull 3x Shares – is structured to go up or down in value 3 times the amount of the S&P 500 index on any given trading day. ETFs which are both Leveraged and Inverse are classified as “Inverse”.
- Active ETFs are managed based on the decisions of a fund manager, rather than tracking an index, or implementing a strictly rule-based strategy.
- ETNs (Exchange-Traded Notes) are instruments structured to behave like ETFs, but which are not actually funds holding constituents. They are notes issued by a bank or other institution that promise to match the return of a particular index or trading strategy. There are advantages and risks to ETNs, which any potential investor should be aware of. (See Investopedia article: ETF or ETN – What’s the Difference?)
ETF Search
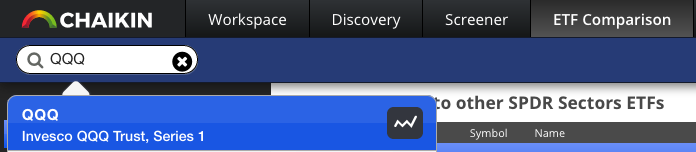
Enter an ETF ticker symbol (such as “QQQ”) into the ETF Search Box to see matching results.
Click on any result to select an ETF and its Group for display in the ETF Comparison page (press <Return> to select the top result).
You can also press the Chart icon to chart the selected ETF in the Workspace.
If you enter the ticker symbol of a stock, you will be prompted to chart the stock in the Workspace.
ETF Navigator
Use the ETF Navigator to select an ETF Group or Subgroup for display in the ETF Comparison page.
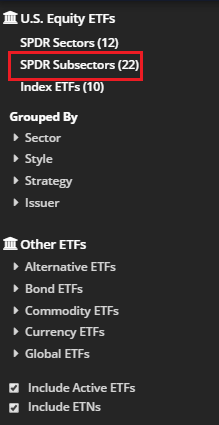
A selectable Group or Subgroup is followed by the count of ETFs it contains, e.g. “SPDR Sectors (11)“.
U.S. Equity ETFs
ETFs which are listed in the U.S. and hold U.S. equities are the main focus of Chaikin Analytics, since we have Power Gauge Ratings for their constituent holdings.
There are 3 “special” Groups of U.S. Equity ETFs:
- SPDR Sectors
- SPDR Subsectors
- Index ETFs.
Additionally, U.S. Equity ETFs are grouped by:
- Sector
- Style
- Strategy
- Issuer
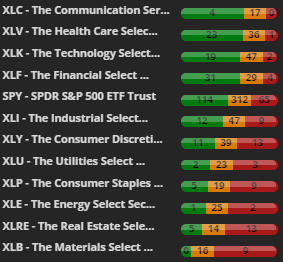
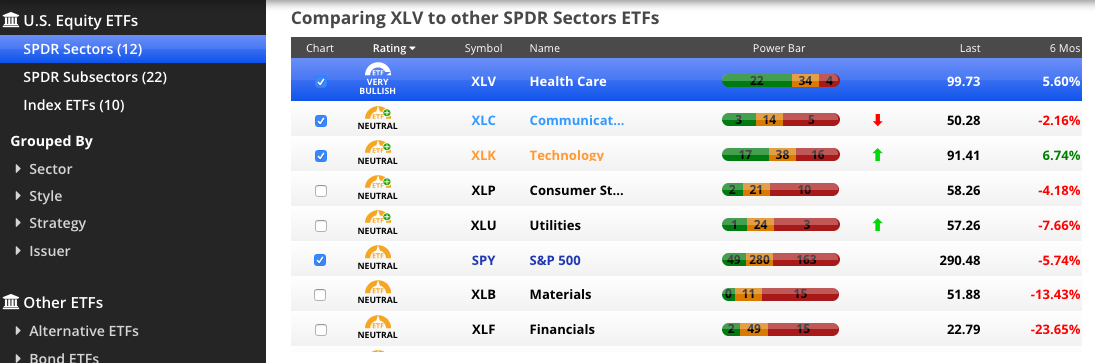
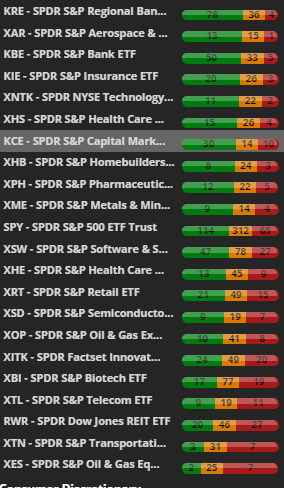
SPDR Sectors
Click on SPDR Sectors in the ETF Navigator to see the SPDR Sector ETFs compared to each other, along with the SPY (the State Street S&P 500 ETF).
State Street Global Advisors created the Select Sector SPDR Funds (or “Spiders”) to track the 11 Standard & Poors Sectors. (“SPDR” stands for “S&P Depository Receipts”). They are:
Sector funds represent an excellent way to invest in a specific segment of the U.S. economy, while reducing exposure to individual stocks.
The SPDR Sector Funds contain only the large cap stocks which make up the S&P 500 Index. There are other Sector funds from other issuers.
Chaikin suggests a “top-down” strategy of holding strong stocks in strong Sectors and Industries. The ETF Comparison view makes it easy to see at a glance which Sectors are more heavily Bullish or Bearish than the overall market, including significant changes over the past week.
Often sectors follow an observable “sector rotation”, in coordination with the overall business cycle, where money flows out of one or more sectors and into others. If you keep an eye on this page, you will notice sector rotation patterns over time.
SPDR Subsectors
The S&P Subsectors are comprised of approximately 1000 large and midcap stocks in the S&P Total Market Index, including stocks whose market cap is not large enough to quality for the S&P 500.
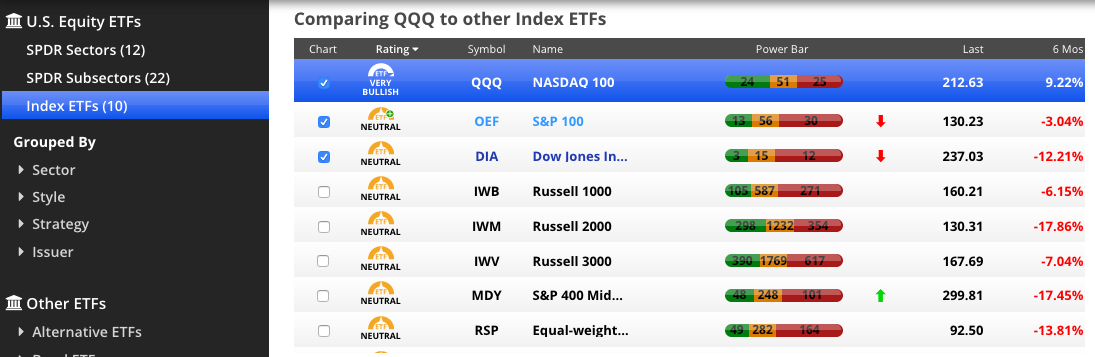
Index ETFs
The Index ETFs Group contains selected common ETFs tracking major U.S. Indexes, allowing you to see at a glance which are more Bullish or Bearish, and which are outperforming.
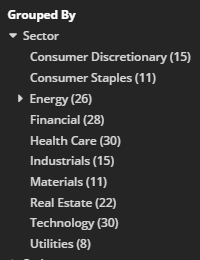
Grouped By Sector
Use the Sector ETF Groups to compare Sector ETFs from various issuers
For instance, select “Health Care” to see various Health Care ETFs compared to each other:
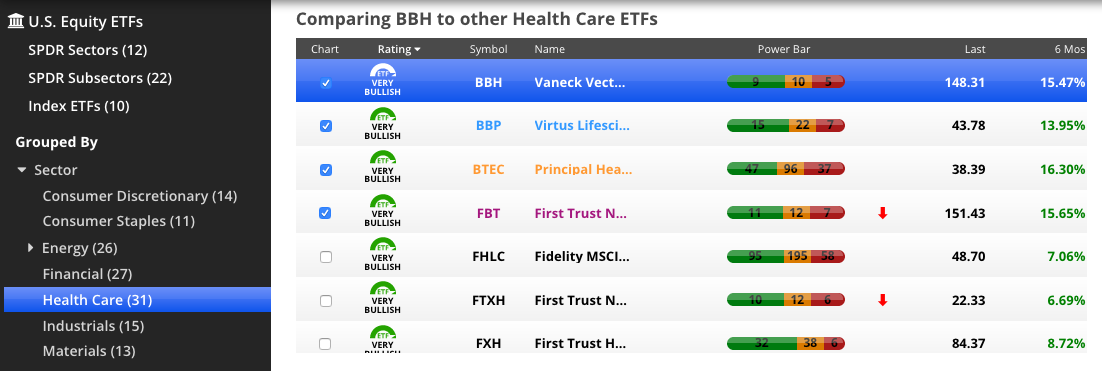
You’ll quickly see that not all ETFs which cover the same Sector are created equal.
This is an important starting point when considering investing in an ETF.
Grouped by Style
The most common U.S. Equity ETFs hold stocks based on a combination of Market Cap and Growth/Value style:
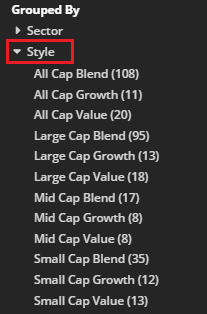
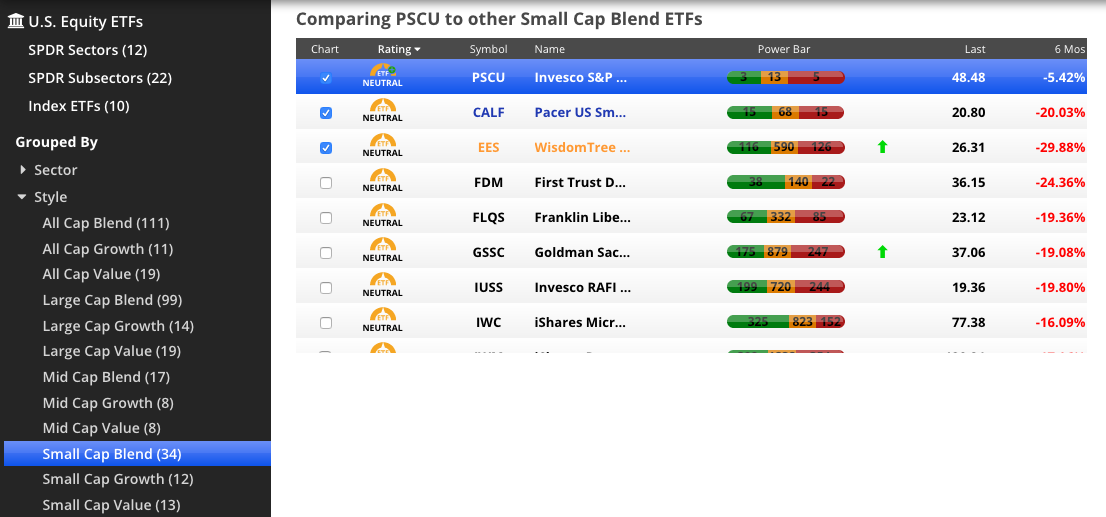
Select any of these to compare ETFs of that Style grouping, for instance, all Small Cap Blend ETFs.
Grouped by Strategy
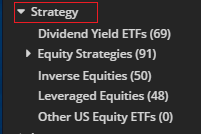
Select an ETF Group in the “Strategy” section to compare ETFs which share a common strategy or fund structure. Groups included in this section are:
- Closed End Funds. While technically, not ETFs, Closed End Funds (“CEFs”) are similar in that they exchange-listed instruments, with an underlying portfolio of holdings, which trade intraday, unlike mutual funds, which are only priced at the close of trading. They are actively managed and issue a fixed number of shares. This Group contains a variety of CEFs which hold U.S. Equities.
- Dividend Yield ETFs. ETFs which hold stocks that offer a high, or consistent, dividend yield.
-
Equity Strategies.
- Ethical ETFs. ETFs which hold stocks based on a values of social responsiblity, from Biblical Responsibility funds to Women in Leadership funds.
- Momentum ETFs. ETFs which hold stocks that have exhibited notable price momentum.
- Additional Equity Strategy ETF subgroups may be found here as they are created.
- Inverse Equities. Contains a variety of ETFs which hold U.S. stocks as short positions, allowing investors to bet on downside activity. These may also be “leveraged” (see below).
- Leveraged Equities. Contains long-only ETFs which are structured to return a multiple of the underlying asset performance. For instance, the SPXL – Daily Direxion S&P 500 Bull 3x Shares – returns is structured to go up or down in value 3 times the amount of the S&P 500 index on any given trading day. ETFs which are both Leveraged and Inverse are in the Inverse Equities group.
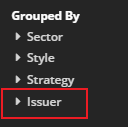
Grouped by Issuer
Select an Issuer from this section to compare all of the U.S.-listed ETFs from that Issuer.
Other ETFs
Other ETFs hold positions which are not U.S. equities, and have their own sections in the ETF Navigator.
Chaikin does not provide Power Bar breakdowns for these ETFs, but most Fixed Income and Global Equity ETFs will have Power Gauge Ratings. However, all other information is available.
These consist of:
- U.S. ETFs holding instruments other than equities (or with an “alternative” fund structure), and
- Global ETFs, which are U.S.-listed funds holding any non-U.S. assets.
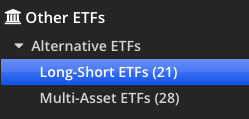
Alternative ETFs
The Alternative ETFs section contains groups of funds which either hold U.S. instruments other than stocks, bonds, or commodities – or which have a non-traditional fund structure.
These include listed Hedge Funds, Hedged Strategy ETFs, Long-Short ETFs, Multi-Asset ETFs, Options Strategy ETFs, Volatility ETFs, and other miscellaneous alternatives.
Bond ETFs
The Bond ETFs section includes groups of ETFs holding various types of U.S. fixed income securities.
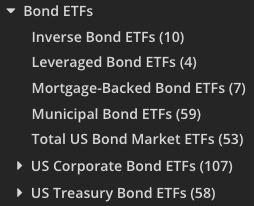
- Inverse Bond ETFs. Contains a variety of ETFs which hold U.S. bonds as short positions, allowing investors to bet on downside activity.
- Leveraged Bond ETFs. Contains long-only ETFs which are structured to return a multiple of the underlying asset performance.
- Mortgage-Backed Bond ETFs. Funds holding bonds secured by a mortgage or pool of mortgages.
- Municipal Bond ETFs. CA Municipal Bond funds, National Municipal Bond funds, NY Municipal Bond funds.
- Total US Bond Market ETFs. Funds holding a cross-section of US fixed-income securities.
-
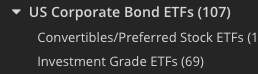
US Corporate Bond ETFs. Various groups of funds holding debt issued by U.S. companies.
- Convertibles/Preferred Stock ETFs. Funds holding convertible debt or preferred stock issued by US companies.
- Investment Grade ETFs. Funds holding highly-rated debt issued by U.S. companies.
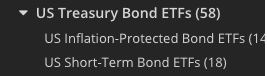
- US Treasury Bond ETFs. Various groups of funds holding US government debt securities.
Commodity ETFs
The Commodity ETFs section includes groups of funds holding physical U.S. commodities: Agricultural Commodity ETFs, Broad Commodity ETFs, Energy (Oil & Gas) ETFs, Industrial Metals ETFs, and Precious Metals ETFs.
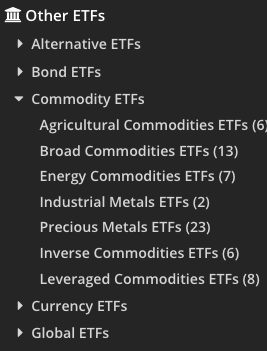
- Inverse Commodity ETFs hold US commodities as short positions. These are generally structured as ETNs.
- Leveraged Commodity ETFs hold US commodities in leveraged fashion, returning a 2x or 3x multiple of performance. These are generally structured as ETNs.
Currency ETFs
The Currency ETFs section includes ETFs tracking single-currencies or holding multi-currency baskets.
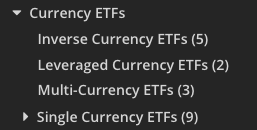
- Inverse Currency ETFs hold currencies as short positions.
- Leveraged Currency ETFs hold currencies in leveraged fashion, returning a 2x or 3x multiple of performance.
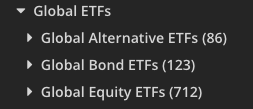
Global ETFs
The Global ETFs section includes all ETFs holding international issues of all asset types (Alternatives, Bonds, Equities).
Settings
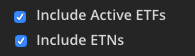
- x Include Active ETFs. Check this box to include actively managed funds in your results. By default, they will be shown.
- x Include ETNs. Check this box to include Exchange-Traded Notes in your results. By default, they will be shown.
Comparison Table
The ETF Comparison Displays as a table in the default view. We have discontiued the view that contains a partial table and a partial chart and now display the full table as the default.
Normal Mode
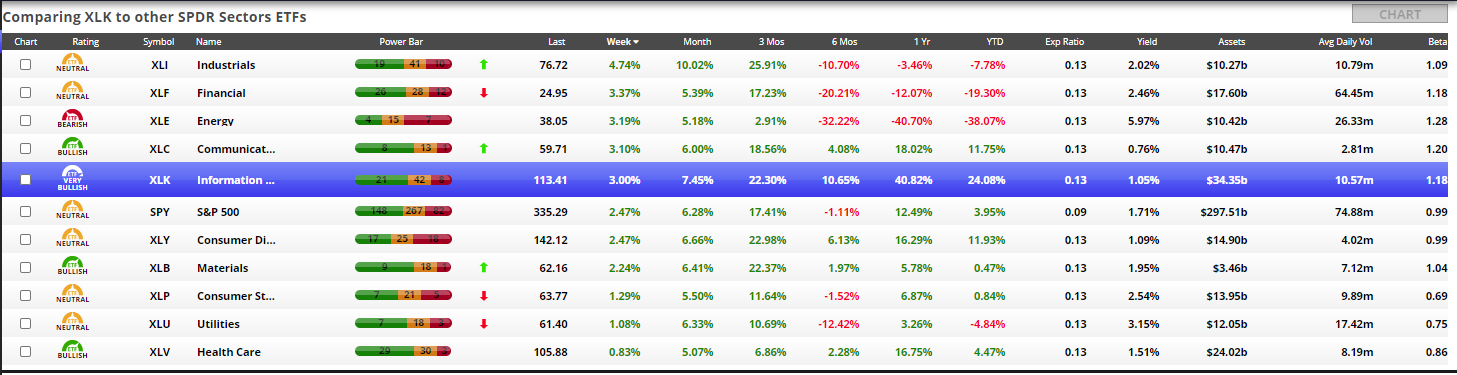
When an ETF Group is first loaded, by default results are ordered most Bullish to most Bearish by Power Bar, or by 6- month performance if no Power Bar is available.
In Normal Mode, the following fields are shown:
- Chart. Check box to select which ETFs to show in the Comparison Chart. By default, the top 4 are selected.
- Symbol. Ticker symbol of the ETF.
- Name. Name of the ETF. If it is cut off, hover to see a popup showing the full name.
- Power Bar. Chaikin Power Bar showing Bullish/Neutral/Bearish breakdown of ETF constituent holdings. Shown for U.S. Equity ETFs only.
- Weekly Mover arrow. Green or Red up/down arrows are shown next to the ETFs in the group with the 3 biggest positive and negative changes in Power Bar rank over the past week.
- Last. Current ETF price per share (within 1 minute, during trading session).
- Week, Month, 3 Mos, 6 Mos, 1 Yr, YTD. Percent change over 1 week, 1 month, 3 months, 6 months, 1 year, and Year-to-date.
- Exp Ratio. The expense ratio of the ETF.
- Yield. Annual dividend yield of the ETF.
- Assets. Assets under management of the ETF.
- Avg Daily Vol. Average daily shares of the ETF traded over the past month.
- Beta. Correlation of ETF performance to the S&P 500 index, ranging from -1 to 1.
Click a column heading to sort by that column descending, and again to sort by that column ascending.
Chart Mode
To view selected ETFs with Charts, you simply select the ETFs you wish to view by clicking on the box next to the ETF's Name to check that box. Then, click on the Chart Icon at the top right of the Screen and the Chart view will appear.
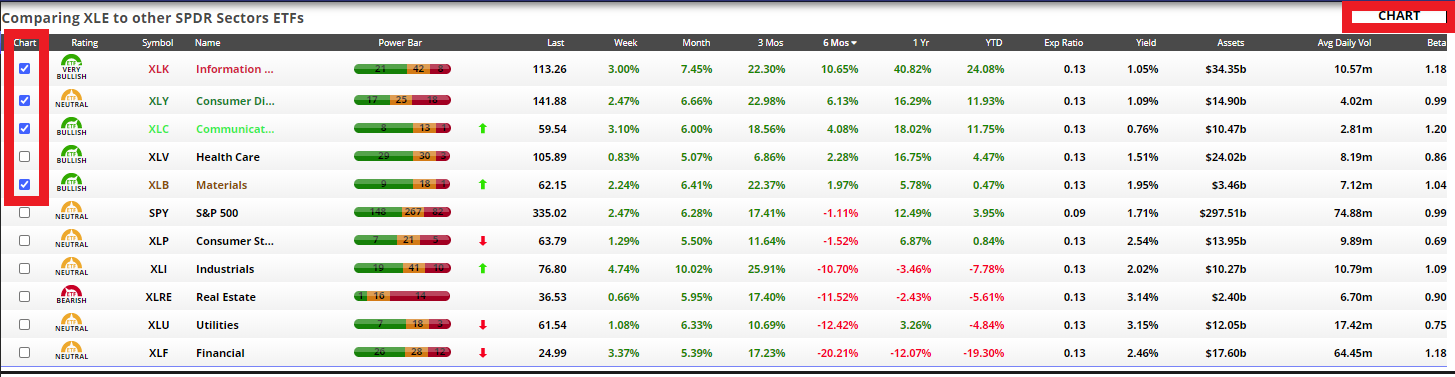
The table will be partially suppressed and the chart will appear as shown below.
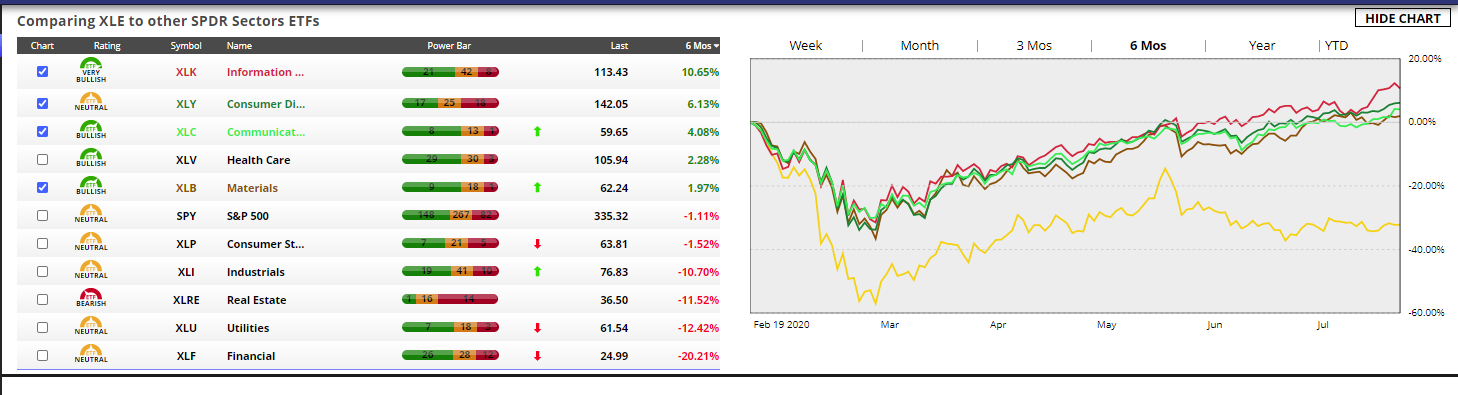
Click on Hide Chart to return to the default Table view.
Comparison Chart
The Comparison Chart shows relative performance of selected ETFs over a time period, indexed to a starting point.
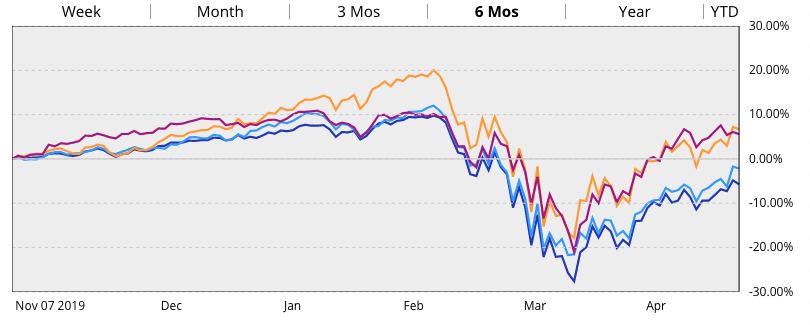
Six month performance is shown by default, or you can select Week, Month, 3 month, Year, or Year-To-Date.
ETF Summary & Holdings
Click on an ETF in the Comparison Table to display its Summary and Top Holdings breakdown.
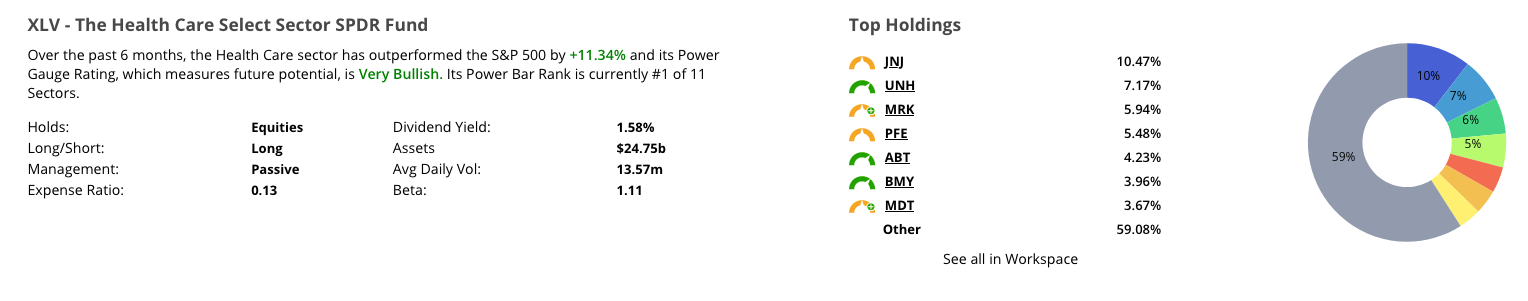
Summary
The Summary at left recaps the ETF’s recent performance, Power Bar score, and key information.
- Holds. Type of assets held by the ETF.
- Strategy. Long, Short, Leveraged or a combination of these.
- Management. Active or Passive.
- Dividend Yield. Annual dividend yield of the ETF.
- Assets. Total assets under management in the fund. Proceed with caution before investing in funds with very low assets.
- Avg Daily Vol. Average daily shares of the ETF traded over the past month. Be more cautious when considering investing in illiquid ETFs.
- Beta. A measure of correlation between the ETF and the S&P 500, ranging between -1 and 1.
Top Holdings
- The Top Holdings breakdown at right shows a list and chart of the ETF’s top 7 holdings by weight.
- Click “See all in Workspace” to switch to the Workspace, with all of the ETF’s holdings displayed in the Watchlist.
- Holdings are available for U.S. Equity ETFs.
