Screener Criteria Reference – Chaikin Analytics
This article explains every filter available in the Chaikin Analytics Screener. It's designed for users who want to build targeted screens using the platform’s proprietary Power Gauge Rating and its supporting factors, along with technical signals, performance metrics, and selected fundamentals.
🔗 Looking for step-by-step instructions? Click here to read How to Use the Screener — a guided walkthrough of how to build and run a screen using these criteria.
Getting Started with the Screener
The Chaikin Analytics Screener lets you search for stocks or ETFs that meet specific technical, fundamental, and model-based criteria. Whether you're looking for stocks with strong Money Flow and a Bullish Power Gauge or trying to spot under-the-radar opportunities with improving technical setups, the Screener helps you act with focus and confidence.
The Screener is built around Chaikin’s most powerful tools: the Power Gauge Rating, its Components and Factors, Industry Rankings, and a carefully selected set of technical and performance indicators.
Before diving into the filters, you’ll need to choose a Starting Universe — the list of securities you want to evaluate.
Choosing a Starting Universe
Your first step is to select a Starting Universe, which determines which stocks the Screener will search through. The default universe is the Russell 3000, but you can switch to other preset groups such as the S&P 500, NASDAQ 100, Value/Growth indexes, sector lists, or your own saved Watchlists (called User Lists).
🔍 You can only screen from Watchlists (User Lists), not Portfolio Lists. User Lists may take up to 24 hours to appear after creation or import.
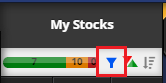
Understanding the Global Filter
The Global Filter automatically excludes stocks that fall below certain baseline criteria, helping ensure your screens focus on liquid, investable names.
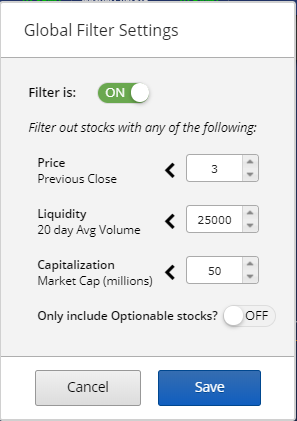
By default, the Global Filter excludes:
- Stocks priced under $3
- Stocks with less than 25,000 shares traded on average over the past 20 days
- Market cap under $50 million
- Stocks that are not optionable
The filter is shared across your account, so changes apply in both your Watchlists and the Screener.
Screener Criteria Breakdown
Once your universe is set, you can add one or more filters. These are grouped by type:
Power Gauge Criteria
- Power Gauge Rating: Filter by current rating, rating persistence, or rating change
- Power Gauge Components/Factors: Select up to 3 factors (e.g., Earnings Growth, Expert Activity, Price/Sales Ratio). Each can be filtered based on strength or direction.
⚠️ Tip: Avoid using contradictory criteria on the same factor — doing so will return zero results.
Performance Criteria
- Screen by absolute returns (1M, 3M, 6M, YTD) and relative performance vs SPY
- Combine multiple statements for advanced ideas like “YTD up 20% but down 5% in the past month”
Technical Criteria
- Filter by price levels, Money Flow, Relative Strength, Relative Volume, or proximity to 200-day average
- You can set Min/Max price to limit screens by share price
Fundamental Criteria
- Set thresholds for Market Cap, Dividend Yield, and upcoming or recent Earnings Report Date
- Other key fundamental metrics are already included in the Power Gauge Factors
🧠 Fundamentals in Chaikin are chosen because they’ve proven predictive of future intermediate-term relative performance and are normalized by industry or the Russell 3000.
Buy/Sell Signals
- Filter for stocks that triggered one or more of Chaikin’s 12 Buy or Sell Signals in the last week
-
These include technical alerts like Oversold Buy, Money Flow Buy, and Relative Strength Breakout
Tips for Smarter Screening
- Start simple: Use just a few high-impact filters to begin
- Refine with precision: Add technical or fundamental filters once you’ve narrowed your results
- Use Performance + Signal combos: Look for stocks up YTD that recently hit a Buy Signal
-
Save your work: Screens can be saved and re-used — name them based on your strategy
Need Help?
Our support team is ready to help. If you’d like guidance setting up a screen or understanding how a filter works, call us at 1-877-697-6783.
📋 Reference Tables (For Advanced Users)
If you're looking for a deeper breakdown of all available screening options, this section includes detailed tables of each filter type. These tables list every setting available within the Screener, including definitions and explanations for how they work.
You’ll find reference material covering:
- Power Gauge Factors and Components
- Technical Filters
- Performance Options
- Fundamental Data Points
- Buy and Sell Signal Triggers
- ETF-specific Screening Filters
These tables are ideal for experienced users who want to fine-tune their approach, understand what’s driving each filter, or build highly customized screens.
📌 This section is meant as a supporting resource and may be updated as new criteria are added or refined in the platform.
Starting Universe
| All Rated Stocks | All active stocks in the Chaikin Analytics system with a valid Power Gauge Rating |
| Russell 3000 |
All stocks in the iShares Russell 3000 ETF (IWV). These include large, mid, and small cap stocks covering about 98% of the total market value of U.S. listed companies.
(Note: for various reasons there may not be exactly 3000 stocks in the Russell 3000 list). |
| SP500 |
All stocks in the SPDR SP500 ETF (SPY). These are the 500 largest cap stocks listed on U.S. exchanges as determined by Standard & Poors.
(Note: for various reasons there may not be exactly 500 stocks in the SP500 list). |
| Growth Stocks | All stocks in the iShares Russell 3000 Growth ETF (IUSG). |
| Value Stocks | All stocks in the iShares Russell 3000 Value ETF (IUSV). |
| Large Cap Growth | All stocks in the iShares Russell 1000 Growth ETF (IWF). |
| Large Cap Value | All stocks in the iShares Russell 1000 Value ETF (IWD). |
| Small Cap Growth | All stocks in the iShares Russell 2000 Growth ETF (IWO). |
| Small Cap Value | All stocks in the iShares Russell 2000 Value ETF (IWN). |
| Strongest Industries |
Stocks in the top 20% of S&P's Groups, as determined by Chaikin Power Bar Score. Industries without a positive Bullish/Bearish balance are excluded, even if in the top 20%. (This generally reflects the top 12 items in the Industries section of the List Navigator, when sorted by Rating). |
| Weakest Industries |
Stocks in the bottom 20% of S&P’s Industry Groups, as determined by Chaikin Power Bar Score. Industries without a negative Bullish/Bearish balance are excluded, even if in the bottom 20%.
(This generally reflects the bottom 12 items in the Industries section of the List Navigator, when sorted by Rating). |
| Select an Industry… | Select a specific Industry Group as your starting Universe. |
| Select a Sector… | Select one or more of the 11 SPDR Sector ETFs as your starting universe. |
| Select a Subsector…. | Select one or more of the 22 SPDR Subsector ETF’s as your starting universe. |
| Select a User List…. | Select a User List as your Stock Universe. Note that a User List will not be available for screening until 24 hours after it was loaded. |
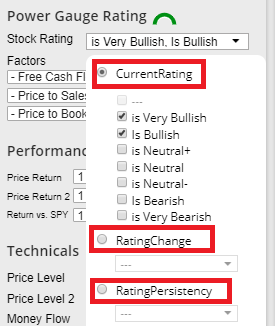
Power Gauge Criteria
The Power Gauge Rating menu allows you to screen for stocks whose Power Gauge Ratings meet certain criteria.
Here the choices for the Power Gauge Rating that may be used in the Screener. You may select to Screen on current rating, Rating Change, or Rating Persistency.
Power Gauge Components and Factors
| Component or Factor | Includes Stock if… |
| — | (empty) |
| is Very Strong | Component or Factor is in the top quintile today |
| is Strong | Component or Factor is in the 2nd quintile today |
| is Neutral | Component or Factor is in the 3rd quintile today |
| is Weak | Component or Factor is in the 4th quintile today |
| is Very Weak | Component or Factor is in the bottom quintile today |
| turned Strong today | Component/Factor was not Strong yesterday but is Strong today |
| turned Strong this week | Component/Factor was not Strong at end of previous calendar week but is Strong today |
| turned Weak today | Component/Factor was not Weak yesterday but is Weak today |
| turned Weak this week | Component/Factor was not Weak at end of previous calendar week but is Weak today |
| big gain this week | Component/Factor had a significant gain from end of previous calendar week to today |
| big loss this week | Component/Factor had a significant loss from end of previous calendar week to today |
Note: It is technically possible to make multiple statements about a Factor which may be contradictory. This is not prevented, but will lead to 0 Results.
Performance Criteria
| Up… | Description |
| At/near high |
Most recent closing price is greater than or equal to the highest closing price for the previous (1 week, 1 month, 3 months, 6 months, 1 year, current year-to-date).
All except “1 week” have a 2% tolerance. |
| At/near low |
Most recent closing price is less than or equal to the lowest closing price for the previous (1 week, 1 month, 3 months, 6 months, 1 year, current year-to-date).
All except “1 week” have a 2% tolerance. |
| Up… | Most recent closing price is at least (2%, 5%, 10%, 20%, 50%) greater than closing price (1 week ago, 1 month ago, 3 months ago, 6 months ago, 1 year ago, at end of prior calendar year). |
| Down… | Most recent closing price is at most (2%, 5%, 10%, 20%, 50%) less than closing price (1 week ago, 1 month ago, 3 months ago, 6 months ago, 1 year ago, at end of prior calendar year). |
| Return vs. SPY | Description |
| Up… | Percent change of stock’s closing price is at least (2%, 5%, 10%, 20%, 50%) greater than percent change of SPY’s closing price over (1 week, 1 month, 3 months, 6 months, 1 year, current year-to-date) |
| Down… | Percent change of stock’s closing price is at most (2%, 5%, 10%, 20%, 50%) less than percent change of SPY’s closing price over (1 week, 1 month, 3 months, 6 months, 1 year, current year-to-date) |
Note: It is technically possible to make multiple statements about Price Return which are contradictory. This is not prevented, but will lead to 0 Results.
Technical Criteria
| Menu | Selection | Description |
| Price Level | Overbought | Closing price is high in its short-term range. OB/OS is greater than or equal to 70. |
| Oversold | Closing price is low in its short-term range. OB/OS is less than or equal to 30. | |
| Above Rising LT trend | Closing price is above its long term trend; trend rising over last 3 months, and last 5 days. | |
| Below Falling LT trend | Closing price is below its long term trend; trend is falling over last 3 months, and last 5 days. | |
| Near Upper Band | Closing price is within 2% of its Upper Chaikin Band (above or below). | |
| Above Upper Band | Closing price is greater than or equal to its Upper Chaikin Band. | |
| Near Lower Band | Closing price is within 2% of its Lower Chaikin Band (above or below). | |
| Below Lower Band | Closing price is less than or equal to its Lower Chaikin Band. | |
| Above EMA 21 | Closing price is greater than its 21-day Exponential Moving Average (EMA21). | |
| Below EMA 21 | Closing price is less than its 21-day Exponential Moving Average (EMA21). | |
| Above LT Trend | Closing price is greater than its long term trend | |
| Below LT Trend | Closing price is less than its long term trend. | |
| Crossover EMA21 today | Closing price was less than or equal to EMA21 yesterday and Closing price is greater than EMA21 today. | |
| Crossunder EMA21 today | Closing price was greater than or equal to EMA21 yesterday and Closing price is less than EMA21 today. | |
| Crossover LT Trend today | Closing price was less than or equal to LT Trend yesterday and Closing price is greater than the long term trend today. Also: Chaikin Trend, long term trend. | |
| Crossunder LT Trend today | Closing price was greater than or equal to the long term trend yesterday and Closing price is less than LT Trend today. Also: Chaikin Trend, long term trend. |
| Menu | Selection | Description |
| Money Flow | Very Strong | Chaikin Money Flow is greater than or equal to 25 |
| Strong | Chaikin Money Flow is greater than or equal to 5 | |
| Weak | Chaikin Money Flow is less than or equal to -5 | |
| Very Weak | Chaikin Money Flow is less than or equal to -25 | |
| 1 mo high persistency | Chaikin Money Flow was greater than 0 70% of the last 20 trading days | |
| 1 mo low persistency | Chaikin Money Flow was less than 0 70% of the last 20 trading days | |
| 3 mo high persistency | Chaikin Money Flow was greater than 0 70% of the last 60 trading days | |
| 3 mo low persistency | Chaikin Money Flow was less than 0 70% of the last 60 trading days | |
| 6 mo high persistency | Chaikin Money Flow was greater than 0 70% of the last 120 trading days | |
| 6 mo low persistency | Chaikin Money Flow was less than 0 70% of the last 120 trading days |
| Menu | Selection | Description |
| Rel Strength | Very Strong | Chaikin Relative Strength is greater than or equal to .8 |
| Strong | Chaikin Relative Strength is greater than or equal to .6 | |
| Weak | Chaikin Relative Strength is less than or equal to .5 | |
| Very Weak | Chaikin Relative Strength is less than or equal to .2 | |
| 1 mo high persistency | Chaikin Relative Strength was greater than .5 70% of the last 20 trading days | |
| 1 mo low persistency | Chaikin Relative Strength was less than .5 70% of the last 20 trading days | |
| 3 mo high persistency | Chaikin Relative Strength was greater than .5 70% of the last 60 trading days | |
| 3 mo low persistency | Chaikin Relative Strength was less than .5 70% of the last 60 trading days | |
| 6 mo high persistency | Chaikin Relative Strength was greater than .5 70% of the last 120 trading days | |
| 6 mo low persistency | Chaikin Money Flow was less than 0 70% of the last 120 trading days |
| Menu | Selection | Description |
| Relative Volume | Very Heavy | 9 day average volume is greater than or equal to 2 times 90 day average volume |
| Heavy | 9 day average volume is greater than or equal to 1.5 times 90 day average volume | |
| Light | 9 day average volume is less than or equal to .5 times 90 day average volume | |
| Very Light | 9 day average volume is less than or equal to .25 times 90 day average volume |
Note: In all cases above “Today” refers to the most recent Trading Day for which market data is available.
Fundamental Criteria
| Menu | Selection | Description |
| Market Cap | Micro Cap | Market Cap is less than $300 million |
| Small Cap | Market Cap is between $300 million and $2 billion | |
| Mid Cap ($2b – $10b) | Market Cap is between $2 billion and $10 billion | |
| Large Cap (> $10b) | Market Cap is at least $10 billion | |
| Small & Mid Cap | Market Cap is between $300 million and $10 billion | |
| Mid & Large Cap | Market Cap is at least $2 billion | |
| Div Yield | Positive | Dividend Yield > 0 |
| 1%-5% | Dividend Yield is at least (1%, 2%, 3%, 4%, 5%) | |
| Earnings Date | Today/Yesterday | Company reported Earnings either yesterday or today* |
| Tomorrow | Company reports Earnings tomorrow | |
| Within the next week | Company reports Earnings within the next 7 days | |
| Within the past week | Company has reported Earnings within the last 7 days. | |
| Beta | Low < 1 | Lower volatility than the market (S&P500) |
| =>1 and <=2 | Voltatily at the market or moderately higher | |
| High >2 | Much higher volatility than the market (S&P500) |
Note: Other Fundamental fields may be represented as Factors in the Rating Criteria section.