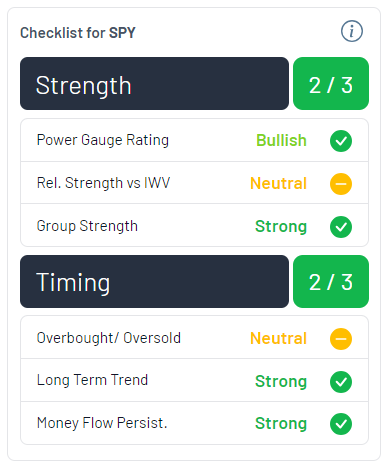
Chaikin Analytics is a methodical tool that helps you decide when to buy and sell stocks. It mainly focuses on the Power Gauge Rating but also looks at other indicators to give you a more complete picture. This approach helps improve your chances of making profitable trade by taking a weight of the evidence approach.
While there is no substitute for reading patterns and trends on the chart yourself, the Pre-Trade Checklist is designed to be your guide to the Chaikin Analytics charts. You can read more about our charts and how to read them here. Keep in mind the Pre-Trade checklist is designed to interpret the Chaikin Analytics chart from the angle on entering a bullish trade. Fully understanding the Chaikin Chart independent of the Pre-Trade Checklist will better your success with Chaikin Analytics. The indicators are designed to be used in conjunction with each other. They are:
Strength
- The Power Gauge Rating (What does our model say about the stock?) This will reference the PowerGauge Rating itself.
- Rel Strength vs SPY (What does the market say?) This is a direct reference to the Rel. Strength vs SPY on the Chaikin Chart.
- Industry Strength (Will this stock get tailwinds due to an overall industry lift or the opposite?) This will reference the Industry Rating at the top of the chart.
Timing
- Overbought/Oversold (Is it time to enter from a short term perspective?) This is a direct reference to the Overbought/Oversold graph in the Chaikin Chart. Wait refers to a stock over 70 on this chart (Overbought). Neutral references a stock between 30 and 70(Middle of the Trading Cycle). Early refers to a stock below 30 (Oversold) with a continued downward trend. Optimal refers to a stock below 30 (Oversold) with an upward trend.
- Long Term Trend (Is this stock in a sustained technical uptrend?) This is a direct reference to the Blue line in the Chaikin Chart.
- Chaikin Money Flow Persistency (What does “Smart Money” say?) This is a direct reference to the Chaikin Money Flow in the Chaikin Chart and how positive it has been over the last 3 months.

If all of the checklist indicators are green, the weight of the evidence points to the likelihood this stock will outperform in the coming months. The fewer indicators that are green, the less likely for a positive outcome.
The Power Gauge Rating and Rel. Strength vs the SPY are the two most important indicators, but do not discount the importance of all six working together. Your preference should be for all six indicators to be green.
NOTE: The Pre-Trade Checklist is optimized for Bullish investments/trades and is only available with the Power Pulse Premium software level and above. If you do not currently have access to the Pre-Trade Checklist, but would like to, please reach out to our customer service team at 1-877-697-6783 to go over sign up options.